This blogpost might need an introduction to some terms, so let’s first start off with:
What is OMOP?
What is OHDSI?
If you don’t need this introduction, go ahead, scroll down to where the fun starts about our synthetic OMOP database, the python-OHDSI wrapper, and CohortDiagnostics.
OMOP
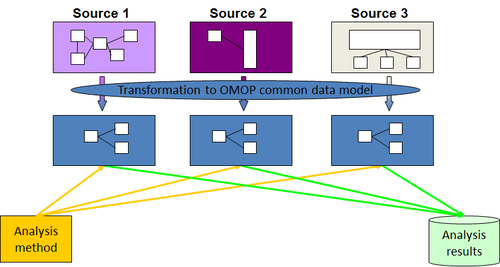
The abbreviation OMOP stands for Observational Medical Outcomes Partnership, and it is a collaborative initiative focused on standardizing the use of healthcare databases for observational research. At its core, OMOP employs a Common Data Model (CDM), providing a unified format for converting diverse healthcare data, facilitating consistent analysis across different datasets. Standardized vocabularies ensure uniform representation of medical concepts, fostering interoperability and comparability. This is extremely useful within vantage6, because the data preparation step in a federated learning network would be much easier if all data sources have their data ready in the same data format. We noticed an upcoming of the OMOP-CDM in the field of oncology research so it’s time to investigate how vantage6 could work with an OMOP-CDM database! https://www.ohdsi.org/data-standardization/
OHDSI
OHDSI, or, Observational Health Data Sciences and Informatics, is a global collaborative initiative focused on generating real-world evidence to improve healthcare decision-making. It operates through an open community of researchers, data scientists, and healthcare professionals who share tools and methodologies. And, you could probably guess already, OHDSI does all their work around the OMOP Common Data Model. The OHDSI community provides a suite of open-source analytical tools supporting various research methodologies, which in turn, can be used by us. Even though vantage6 algorithms can be written in any language, the database connections from vantage6 are all handled in Python. Therefore the OHDSI R tools need to be wrapped so that they can be used by the vantage6 nodes. https://www.ohdsi.org/
The idea is clear: convert all databases to the OMOP-CDM and evidence can be generated using the standardized OHDSI analytics tools.
At the moment the analysis scripts are shared manually, evidence generation is done manually at each site, and results are manually send back to a main researcher. All this can be done by vantage6 now! To make this work we need a couple of things: an OMOP database to work with, python wrappers, and a use case. As a use case we chose to start our OMOP-vantage6 journey by trying to make the OHDSI tool called CohortDiagnostics run within vantage6 since this package is often used at the start of an OHDSI study.
Synthetic OMOP database
First we need some, preferably synthetic, data to put in our OMOP database. At IKNL a synthetic dataset that mimics a part of the Netherlands Cancer Registry (NCR) is available for research purposes.
You can request it here: https://iknl.nl/en/ncr/synthetic-dataset
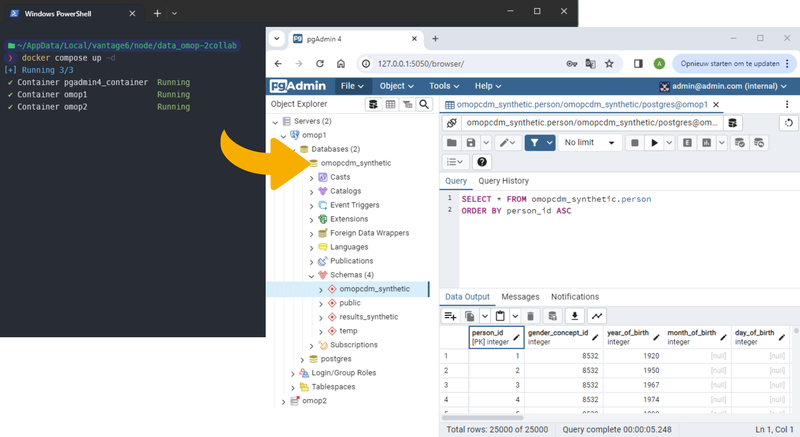
We created a dockerized setup in which this synthetic data is converted to a local OMOP Postgres database, which can easily be (de)activated. With some initialization and afterwards a few command line commands you can have an OMOP database running accompanied by a PGAdmin container to explore the database in a visual way. You can find the code here: https://github.com/IKNL/synthetic-breast-cancer-OMOP-database For easy cohort definition generation we aim to include an ATLAS instance in the future too.
Python wrappers
The OHDSI community did a great job creating a collection of open source R packages (see the image below) containing functions that can be used to perform a complete observational study using the OMOP-CDM.
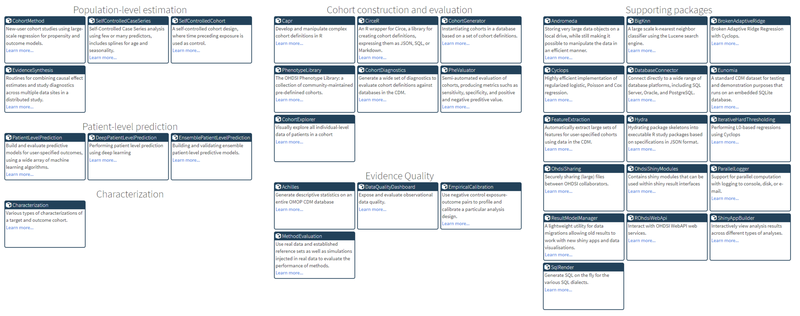
The OMOP-CDM is pretty exhaustive and you have to know how to navigate between different tables so some of these packages are quite complex. Note that if you want to create R algorithms for vantage6 you don’t need these wrappers, but since we prefer working with Python we thought it was easiest to write Python wrappers for (some) of the OHDSI tools (instead of porting the code). Using the rpy2 package we wrapped (the parts we needed from) CirceR, CohortGenerator, DatabaseConnector, SqlRender, FeatureExtraction, and CohortDiagnostics. The resulting Python wrappers are released on https://pypi.org/search/?q=ohdsi (so they can be pip installed now) and the code can be found on Github as a package as well. Super cool, we can now talk to our OMOP database with Python from for example a Jupyter Notebook.
Next to writing the wrappers, the vantage6 infrastructure has been extended to be able to connect to an OMOP database. For this you will have to provide vantage6 with database connection details in the node configuration file. (code) And, to be able to interact with the database in a function in your algorithm a decorator has been built as well. (code)
CohortDiagnostics
To run the CohortDiagnostics algorithm we need a cohort definition. OHDSI’s ATLAS tool provides an interface to create these cohort definitions, for vantage6, we just need the final .json file. We now have all ingredients needed to make a vantage6 algorithm to perform CohortDiagnostics. We created a vantage6 algorithm that (for now) outputs the most important information of the CohortDiagnostics package: https://github.com/IKNL/v6-omop-test/. There is no aggregation step in this algorithm so the user can decide how to process the information outputted.
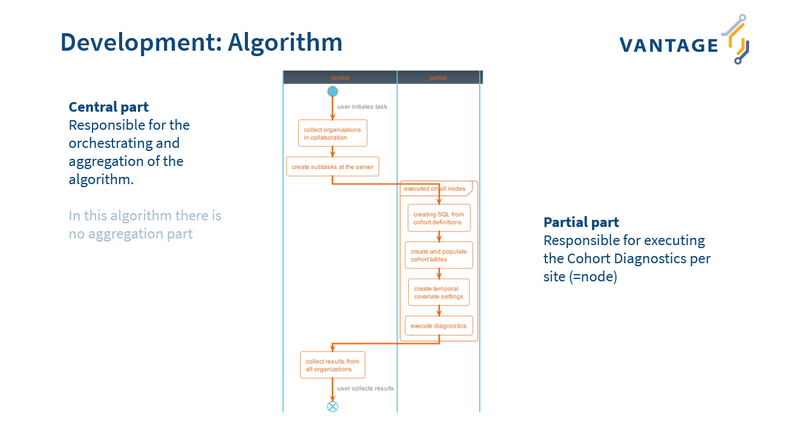
The CohortDiagnostics package usually creates a .zip file containing several .csv files and this zip file then gets shared between sites. In our current test approach the vantage6 algorithm returns a dataframe with the results from one of these .csv files (“incidence_rate.csv”). By running CohortDiagnostics we can now get an overview of the incidence counts, over multiple OMOP databases, for a specific cohort!
Conclusion
No more sending around cohort definitions and .zip files with results (per email), vantage6 is ready to be a solution in your OMOP studies! We are happy to have achieved this first integrated solution, but we remain committed to continuous improvement and pushing the boundaries of innovation, so we invite the healthcare community, vantage6 users, and everyone who is interested to join our efforts.
Federated learning on OMOP datasets, automated cancer statistics, …
From this point onwards there are many more things to discover!
We welcome your thoughts, questions and collaboration on working with OMOP in combination with vantage6.
Thanks for reading, and don’t hesitate to reach out to us!